
📊 Full opportunity report: The Future Of Warfare: AI-Powered Live Warzone Visuals on ThorstenMeyerAI.com — validation score, market gap, and execution plan.
TL;DR
A groundbreaking AI-powered visualization tool now streams live Bitcoin market activity as a cinematic war scene. It uses browser technology to create immersive, real-time visuals without backend infrastructure. This innovation highlights the potential of AI and web tech in future warfare and data visualization.
A new AI-driven visualization transforms live Bitcoin market data into a cinematic battlefield in real-time, using browser technology. This development showcases how advanced web tools can create immersive visualizations without backend infrastructure, illustrating potential future applications in digital warfare and data representation.
The project, developed by isbitcoindead.com, connects directly to the Binance trade stream via WebSocket, with an automatic fallback to Coinbase, ensuring continuous data flow. Every trade is visualized as a combatant—buy orders push the front line from the left, while sell orders counter from the right. Large liquidations are depicted as airstrikes, turning market activity into visceral war scenes.
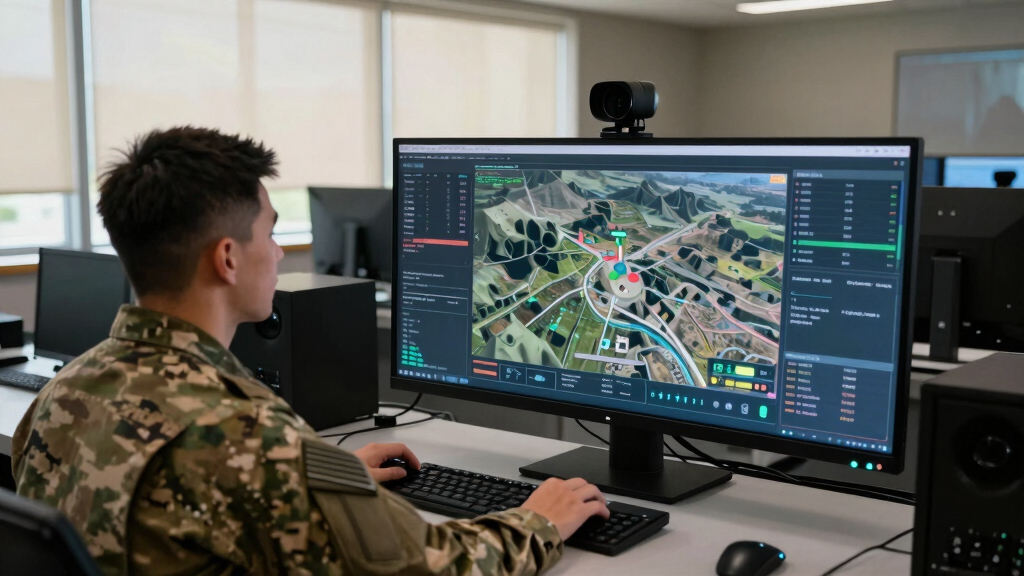
The entire system operates solely within the browser, utilizing Canvas 2D graphics, WebAudio synthesis, and real-time stream processing, with a minimal footprint of approximately 180KB. An automatic camera shifts perspectives between broad views and detailed skirmishes, while a live DEFCON meter indicates market volatility. The visualization also features a scrolling war log narrating ongoing activity and a browser-generated soundtrack that heightens tension. A comprehensive scoreboard tracks seconds won, casualties, and dollar gains, creating a dynamic narrative of market movements.
Importantly, the creators emphasize that Bitcoin War is not a trading tool; it does not involve wallets, signals, or advice. Its purpose is artistic and data-driven, providing a visceral view of market chaos through cinematic visualization. The project is freely accessible at war.isbitcoindead.com, requiring only a modern browser to run.
Implications for Future Digital Warfare and Data Visualization
This development demonstrates how AI and web technologies can be harnessed to produce immersive, real-time visualizations of complex data streams. While currently a creative project, it signals potential future uses in military simulations, strategic planning, and public understanding of market dynamics. The ability to visualize chaos and conflict through browser-based AI tools could influence both entertainment and defense sectors, offering new ways to interpret and interact with data.
browser-based data visualization software
As an affiliate, we earn on qualifying purchases.
As an affiliate, we earn on qualifying purchases.
Emerging Trends in Web-Based AI Visualizations for Data and Warfare
Recent years have seen rapid advancements in browser-based AI and real-time data visualization, driven by increasing web capabilities and AI integration. Projects like Bitcoin War exemplify how these technologies can create immersive experiences without heavy infrastructure. Historically, military and strategic simulations have relied on specialized software; this project indicates a shift toward accessible, artistic representations of complex systems, blending entertainment with data analysis.
While the project is not intended for tactical use, it reflects broader trends in leveraging AI and web tech for innovative visualization, with potential applications extending into training, research, and public engagement about digital conflict.
“This visualization showcases how browser technology can produce complex, real-time representations of chaotic systems, opening new avenues for both artistic expression and strategic analysis.”
— an anonymous researcher
real-time market data display tools
As an affiliate, we earn on qualifying purchases.
As an affiliate, we earn on qualifying purchases.
Unclear Future Applications and Limitations of Browser-Based Visualizations
It remains uncertain how such visualizations might evolve into tactical or strategic tools, or whether they will be adopted in military or governmental contexts. The project is currently purely artistic and experimental, with no official endorsement or integration into operational systems. Additionally, questions about scalability, realism, and potential misuse are still open for discussion.
AI-powered digital warfare visualization
As an affiliate, we earn on qualifying purchases.
As an affiliate, we earn on qualifying purchases.
Next Steps for Development and Broader Adoption of Visual Tech
Future developments may include enhanced realism, interactivity, and integration with other data sources. Developers might explore applications in military training, public education, or market analysis. Monitoring how these visualizations are received and whether they influence related fields will be crucial. The creators plan to continue refining the technology and expanding its capabilities, potentially collaborating with defense and research institutions.
interactive financial market visualization
As an affiliate, we earn on qualifying purchases.
As an affiliate, we earn on qualifying purchases.
Key Questions
Can this visualization be used for actual military strategy?
No, the current project is purely artistic and experimental, designed to visualize market data as a cinematic scene. It is not intended for tactical or operational use.
Is this technology accessible to the general public?
Yes, the visualization runs in any modern browser and is freely available at war.isbitcoindead.com, requiring no special hardware or software beyond standard web capabilities.
What are the potential future uses of this kind of visualization?
Potential future uses include military training simulations, public education about digital conflict, and advanced data analysis. However, its current form remains primarily artistic and experimental.
Does this project involve any real-time trading or financial advice?
No, the creators explicitly state it is not a trading tool and does not involve wallets, signals, or financial advice. Its purpose is to provide a visual narrative of market activity.
Source: ThorstenMeyerAI.com